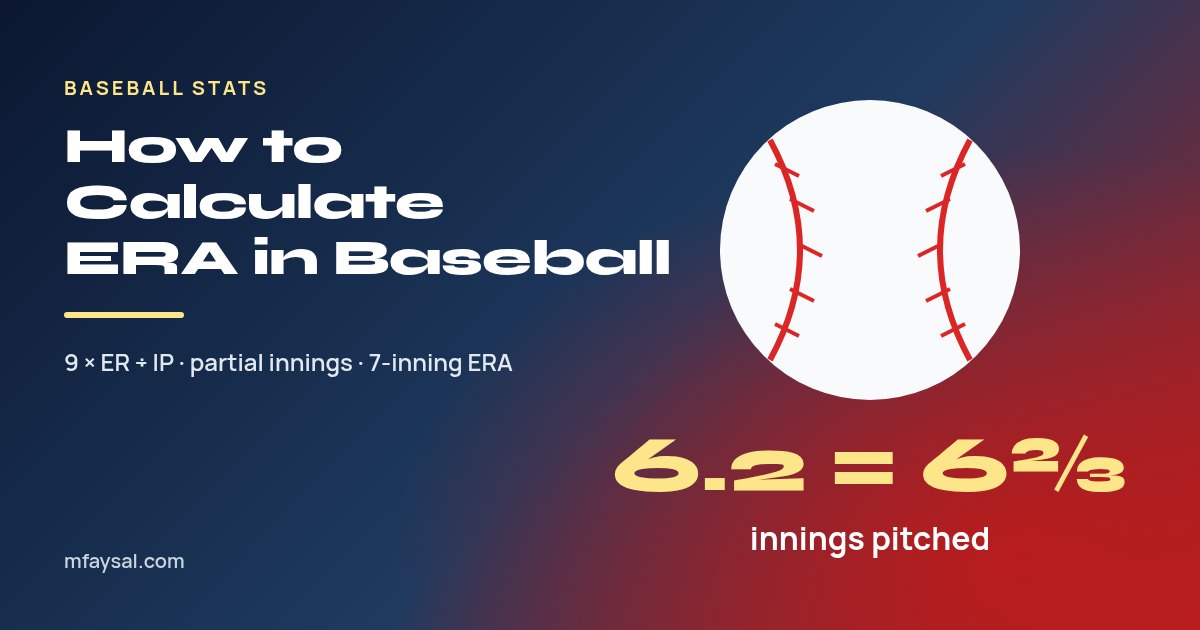
To calculate ERA, multiply a pitcher's earned runs by 9 and divide by innings pitched: ERA = 9 × ER ÷ IP. With partial innings, convert the box-score number first, because .1 means one-third and .2 means two-thirds. So 3 earned runs in 6.2 innings is 9 × 3 ÷ 6.667 = 4.05, not 4.35.
Earned run average is the stat you hear right after a pitcher's win-loss record: "He's 12-6 with a 3.09 ERA." It answers a simple question. How many earned runs does this pitcher allow over a full nine-inning game?
Below you'll find the formula, an innings conversion table, worked examples, the earned-run rules, 7-inning ERA, real league context and a spreadsheet formula. For a quick answer, the ERA calculator handles partial innings for you.
In this guide:
- The ERA formula in plain English
- The partial-innings trap: why 6.2 IP isn't 6.2
- Worked ERA examples
- Earned runs vs unearned runs
- ERA for 7-inning and other short games
- What is a good ERA in MLB?
- Starters, relievers and rules of thumb
- ERA vs WHIP vs FIP
- How to calculate ERA in Excel or Google Sheets
- Common ERA mistakes to avoid
- Frequently asked questions
The ERA formula in plain English
The MLB.com glossary entry for ERA gives the formula as 9 × earned runs ÷ innings pitched. The 9 is there because a regulation MLB game has nine innings.
Think of it as a rate. You take the earned runs a pitcher allowed, work out how many came per inning, then scale that up to a full game.
- Earned runs (ER): runs the pitcher is held responsible for, after removing those caused by errors and passed balls.
- Innings pitched (IP): outs recorded while that pitcher was on the mound, divided by 3.
Example: 2 earned runs in 7 innings. 9 × 2 = 18, and 18 ÷ 7 = 2.57. ERA is usually shown to two decimal places.
The partial-innings trap: why 6.2 IP isn't 6.2
This is the mistake that breaks most hand calculations. Box scores write innings pitched with a dot, but the digit after it counts outs, not tenths.
Because three outs make an inning, .1 means one out (one-third of an inning) and .2 means two outs (two-thirds). You'll never see .3, because the third out completes the inning.
| Box score IP | Outs recorded | As a fraction | Decimal to use |
|---|
| 0.1 | 1 | 1/3 | 0.333 |
| 0.2 | 2 | 2/3 | 0.667 |
| 5.1 | 16 | 5 1/3 | 5.333 |
| 5.2 | 17 | 5 2/3 | 5.667 |
| 6.0 | 18 | 6 | 6.000 |
| 6.1 | 19 | 6 1/3 | 6.333 |
| 6.2 | 20 | 6 2/3 | 6.667 |
| 7.2 | 23 | 7 2/3 | 7.667 |
If you're working with thirds by hand, a fraction calculator keeps the arithmetic exact. Or skip fractions entirely: count outs, and use ERA = 27 × ER ÷ outs. It gives exactly the same answer.
Worked ERA examples
Every example below converts innings to thirds first. The last column shows what you'd get if you typed the box-score number straight into a calculator.
| Situation | IP | ER | Correct ERA | Wrong ERA (dot read as decimal) |
|---|
| Quality start | 6.2 | 3 | 4.05 | 4.35 |
| Rulebook example | 9.1 | 3 | 2.89 | 2.97 |
| Reliever's season | 20.2 | 5 | 2.18 | 2.23 |
| Starter's season | 180.1 | 62 | 3.09 | 3.10 |
| One-out disaster | 0.1 | 2 | 54.00 | 180.00 |
The 9.1 example comes straight from the official rulebook, which works it as 3 × 9 ÷ 9 1/3 = 2.89. Notice that the error shrinks as innings grow, but it never vanishes, and for short outings it's huge.
Combining several outings
Say a starter throws 5.2, 6.1 and 7.0 innings, allowing 2, 3 and 1 earned runs. Add outs, not box-score numbers: 17 + 19 + 21 = 57 outs, which is 19 innings. ERA = 9 × 6 ÷ 19 = 2.84.
Adding 5.2 + 6.1 + 7.0 as decimals gives 18.3, which is wrong. Averaging the three game ERAs (3.18, 4.26 and 1.29) with an average calculator gives 2.91, also wrong, because a simple mean treats a short start the same as a long one. Always total the earned runs and innings first.
Earned runs vs unearned runs
ERA only counts earned runs, so you need to know what gets removed. Under Rule 9.16 of the 2026 Official Baseball Rules, the official scorer rebuilds the inning as if there had been no errors and no passed balls, giving the pitcher the benefit of the doubt.
A few situations come up constantly:
- Errors with two outs: if a fielder's error extends an inning that should have ended, the runs that follow are unearned. The rulebook's own example has an error, then two home runs: three runs score, none earned.
- Passed balls: runs that only score because of a passed ball are unearned. Wild pitches, by contrast, count as the pitcher's fault, so those runs are earned.
- Walks and hit batters: these count against the pitcher, intentional walks included.
- Inherited runners: if a pitcher leaves with runners on base and they score, those runs are charged to the pitcher who put them on.
- Extra-inning runner: the automatic runner on second base is treated as if he reached on an error, so he's unearned if he scores.
How much unearned runs change the number
Picture a start where a pitcher throws 6 innings and allows 4 runs, but 2 of them follow a two-out error. Only 2 runs are earned, so the game ERA is 9 × 2 ÷ 6 = 3.00. Count every run instead and you get 9 × 4 ÷ 6 = 6.00, a stat called RA9 (runs allowed per nine).
That gap is why some analysts prefer RA9 for "what actually happened" and FIP for skill. Box scores list earned runs for you, so you only need these rules when you're scoring a game yourself.
ERA for 7-inning and other short games
The 9 in the formula assumes a nine-inning game. Plenty of baseball isn't played that way. Under NFHS rules, a regulation high school game is seven innings, and fastpitch softball also plays seven.
For those levels, coaches and stat apps usually swap the 9 for a 7:
7-inning ERA = 7 × ER ÷ IP
Example: a high school pitcher allows 12 earned runs in 42.1 innings (42 1/3). The 7-inning ERA is 7 × 12 ÷ 42.333 = 1.98. On the nine-inning scale, the same pitcher would show 2.55.
To convert between scales, multiply a 9-inning ERA by 7/9 (about 0.778), or divide a 7-inning ERA by the same figure. Just make sure you compare like with like. A 2.00 ERA from a softball stat sheet and a 2.00 ERA from MLB are on different scales.
What is a good ERA in MLB?
"Good" depends on the run environment, so start with the league average. These figures come from Baseball-Reference's year-by-year MLB pitching averages:
| Season | MLB-wide ERA |
|---|
| 1968 | 2.98 |
| 2000 | 4.76 |
| 2019 | 4.49 |
| 2022 | 3.96 |
| 2023 | 4.33 |
| 2024 | 4.07 |
| 2025 | 4.15 |
| 2026 | 4.17 |
The 2026 figure is also a neat test of the innings rule. Baseball-Reference lists 19,971 earned runs in 43,079.2 innings, and 9 × 19,971 ÷ 43,079.667 = 4.17.
With a league average near 4.17, here's how different ERAs compare. The index is 100 × league ERA ÷ pitcher ERA, the same idea behind ERA+ but without the park adjustment.
| Pitcher ERA | Index vs 4.17 average | Rough reading |
|---|
| 2.50 | 167 | Elite, award-level |
| 3.00 | 139 | Very good |
| 3.50 | 119 | Above average |
| 4.17 | 100 | League average |
| 4.50 | 93 | Slightly below average |
| 5.00 | 83 | Poor |
To qualify for an ERA title, Rule 9.22(b) requires one inning pitched per scheduled team game, so 162 innings in a 162-game season.
Starters, relievers and rules of thumb
The FanGraphs ERA library page offers a rough rating chart: 2.50 excellent, 3.00 great, 3.40 above average, 3.75 average, 4.00 below average, 4.30 poor and 4.60 awful. It also suggests subtracting about 0.50 for relievers.
Treat that as a loose guide. It was written in 2010, and league averages have drifted since. A 3.75 ERA in 2026 would actually beat the 4.17 league average comfortably.
The reliever adjustment makes sense. MLB.com notes that relievers tend to post lower ERAs because they throw short, max-effort outings. Their small innings totals also make ERA jumpy: a reliever with 15 earned runs in 60 innings has a 2.25 ERA, and one bad night of 3 earned runs in 0.2 innings lifts it to 2.67.
For youth and amateur levels, compare a pitcher with their own league rather than MLB. Fielding quality varies so much that unearned runs and borderline scoring calls carry far more weight.
ERA vs WHIP vs FIP
ERA tells you what happened with runs. Two other common stats help explain why.
| Stat | Formula | What it measures | Main weakness |
|---|
| ERA | 9 × ER ÷ IP | Earned runs allowed per nine innings | Depends on defence, ballpark and scoring calls |
| WHIP | (BB + H) ÷ IP | Baserunners allowed per inning | Treats a single and a home run the same |
| FIP | (13 × HR + 3 × (BB + HBP) − 2 × K) ÷ IP + constant | Results the pitcher controls most | Ignores weak or hard contact on balls in play |
WHIP uses the same innings conversion. A pitcher with 150 hits and 45 walks in 180.1 innings has a WHIP of 195 ÷ 180.333 = 1.08. For context, the 2026 MLB-wide WHIP was 1.304.
FIP adds a yearly league constant so it sits on the same scale as ERA. When a pitcher's ERA is far above their FIP, poor defence or bad luck on balls in play is often part of the story.
How to calculate ERA in Excel or Google Sheets
Spreadsheets read 6.2 as six point two, so you need to convert it. Put innings pitched in column A and earned runs in column B, then use:
=9*B2/(INT(A2)+ROUND(MOD(A2,1)*10,0)/3)
INT takes the whole innings. MOD(A2,1)*10 pulls out the 1 or 2 after the dot, ROUND tidies floating-point noise, and dividing by 3 turns it into thirds. For a 7-inning league, change the leading 9 to 7.
For season totals, convert each outing to outs in column C and add them up:
- Outs:
=INT(A2)*3+ROUND(MOD(A2,1)*10,0) - Season ERA:
=27*SUM(B2:B30)/SUM(C2:C30) - Back to box-score IP:
=INT(D1/3)&"."&MOD(D1,3), where D1 holds total outs
These formulas work the same way in Excel and Google Sheets. Format the ERA cell to two decimal places and you've got a stat sheet that matches the box scores. If a total ever looks off by a few hundredths, check for an innings entry typed as .3, which isn't a valid box-score value.
Common ERA mistakes to avoid
Most wrong ERAs come from a handful of slips:
- Reading .1 and .2 as tenths. Convert to thirds or count outs.
- Using total runs instead of earned runs. Unearned runs stay out of ERA.
- Averaging game ERAs. Total the earned runs and innings, then divide once.
- Mixing scales. Don't compare a 7-inning ERA with a 9-inning one.
- Judging a tiny sample. A reliever's ERA after 5 innings can swing by several runs in one outing.
- Ignoring context. A 4.00 ERA in a high-scoring season can be better than a 3.50 ERA in a low-scoring one.
Frequently asked questions
What is the formula for ERA?
ERA equals 9 times earned runs divided by innings pitched. For example, 3 earned runs in 9 innings is an ERA of 3.00.
How do you calculate ERA with partial innings?
Convert the innings first. In box scores, .1 means one-third of an inning and .2 means two-thirds, so 6.2 innings is 6.667. Then divide 9 times the earned runs by that figure.
What does 6.2 innings pitched mean?
It means six full innings plus two outs, which is 6 2/3 innings or 20 outs. It does not mean 6.2 innings as a decimal.
How do you calculate ERA for a 7-inning game?
Use 7 instead of 9: ERA equals 7 times earned runs divided by innings pitched. High school baseball under NFHS rules and fastpitch softball usually use this scale.
What is a good ERA in MLB?
The MLB-wide ERA was 4.17 in 2026, so anything under about 3.50 is clearly above average and under 3.00 is very good. An ERA around 2.50 or lower is elite.
Do unearned runs count in ERA?
No. Runs that score because of errors or passed balls are unearned and are left out of ERA, though they still count on the scoreboard.
What is the difference between ERA and WHIP?
ERA measures earned runs allowed per nine innings. WHIP measures walks plus hits allowed per inning, so it tracks baserunners rather than runs.
Can ERA be infinite?
Yes, in a sense. If a pitcher allows earned runs without recording an out, they have zero innings pitched, and the ERA can't be calculated. Stat sites usually show it as infinite or a dash.
Last checked: 19 October 2026. Rates, rules and app settings can change, so confirm anything important with the official source linked above.